Distribution
Squirrel distribution 2017-2022
In 2024, we published a new UK squirrel distribution map in partnership with many stakeholders (see credit) that provided data and mapping expertise. This updates the previous 2010 map, which was created by Dr Craig Shuttleworth for the Red Squirrel Survival Trust (RSST). See below for comparison.
It is a visual representation of the recorded presence of both species, though it may not fully reflect true populations. To produce the map, alpha hulls were used to draw polygons around the sighting records. A buffer of 5-10 km was applied to each polygon based on the requirements of the respective data providers.
Map credit: UK Squirrel Accord map of red and grey squirrel sightings data submitted and verified 2017-2022. Data provided by CEDar, Clocaenog Red Squirrels Trust, Colin Lawton, Mammal Society, Mid-Wales Red Squirrel Partnership, National Biodiversity Data Centre, National Parks and Wildlife Service, Red Squirrels Northern England, Saving Scotland’s Red Squirrels, Trees for Life, Ulster Wildlife, University Of Galway and Vincent Wildlife Trust. The map was created by the Mammal Society for the UK Squirrel Accord.

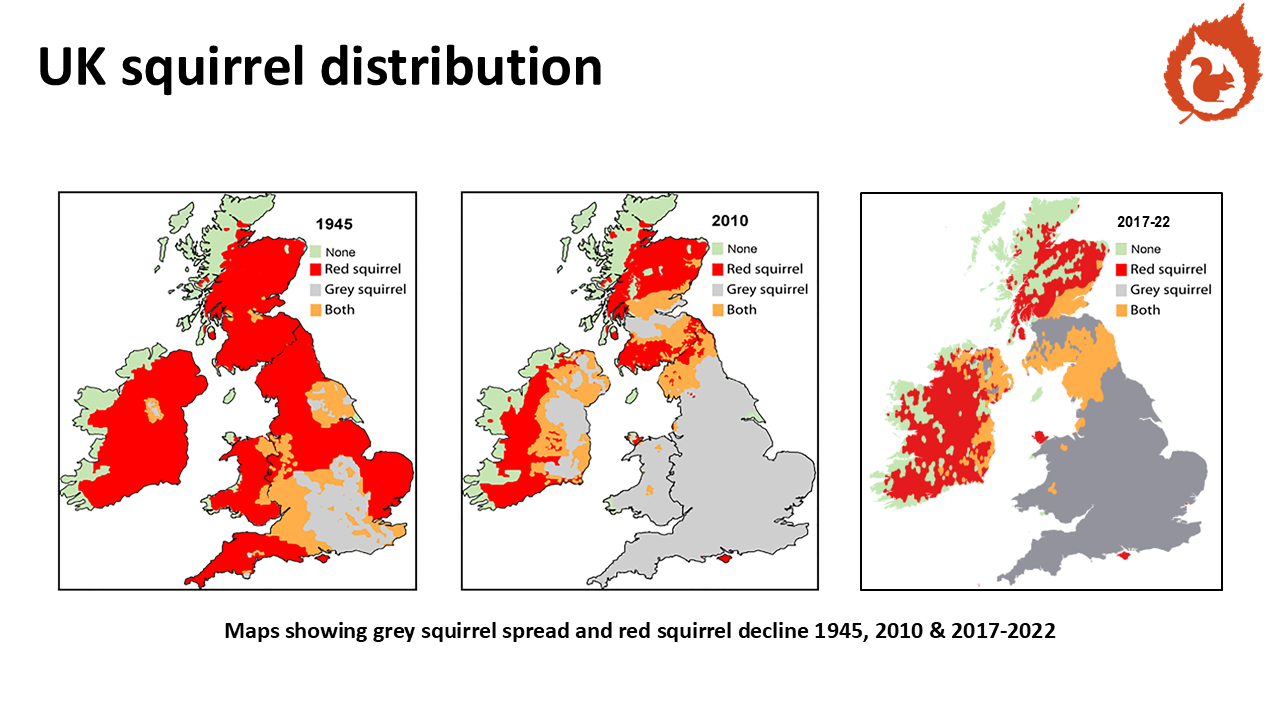
Comparing red and grey squirrel distribution 1945, 2010 and 2017-22.